Top 10 Metrics Every Product Team Should Track With Session Replay Tools
A marketer and product team's playbook for data-driven optimization using session replay.
Imagine this scenario: Your team launches a refreshed signup flow. Initial dashboard metrics look healthy—traffic is climbing, and landing page click-throughs are steady. Hundreds of qualified visitors land on the registration form every day.
Then your product lead notices a problem: activation rate dropped by 28%.
Standard analytics tells you that users are dropping off between step 2 and step 3. You can see the drop-off curve in stark red.
What traditional analytics cannot show you is why.
- Are users confused by a field label?
- Is the "Continue" button unresponsive on specific mobile viewports?
- Is an inline validation error firing off-screen?
- Are visitors clicking non-clickable graphic elements expecting a modal?
- Is an unhandled JavaScript exception quietly blocking the submit handler?
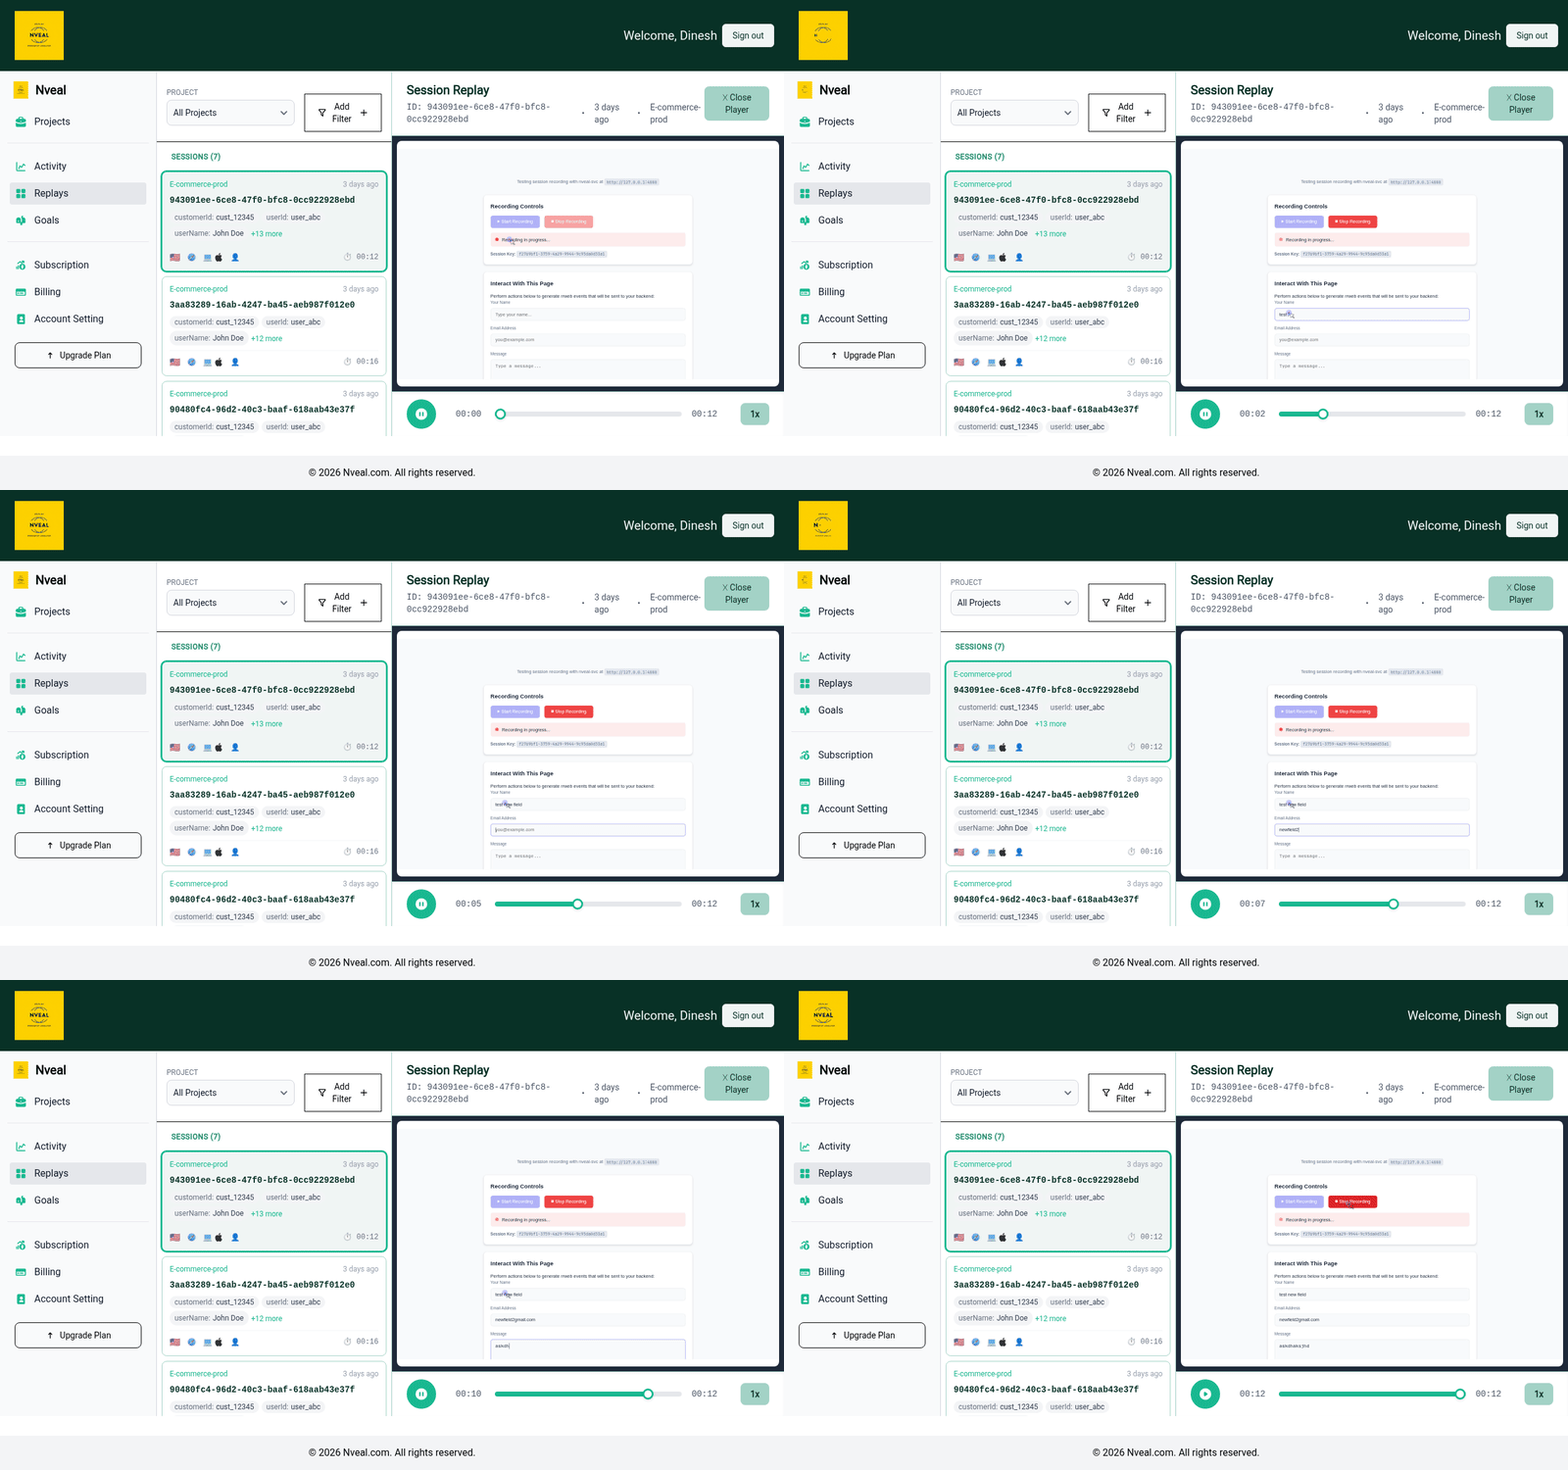
This is where session replay bridges the gap between raw quantitative metrics and actionable qualitative truth.
The Core Distinction: Quantitative vs. Behavioral Analytics
Traditional product analytics and session replay tools are complementary, not competing:
┌──────────────────────────────────────────────────────────┐
│  Traditional Analytics (The "What")                      │
│  • Funnel drop-off rates                                 │
│  • Total conversion percentages                          │
│  • Traffic channel performance                           │
│  • High-level cohort trends                              │
└────────────────────────────┬─────────────────────────────┘
                             │ Identifies anomalies
                             ▼
┌──────────────────────────────────────────────────────────┐
│  Session Replay (The "Why")                              │
│  • Exact user cursor paths and tap sequences             │
│  • Micro-frustration signals (rage clicks, dead clicks)  │
│  • Client-side console & network exceptions              │
│  • Form hesitation and UI layout breakage                │
└──────────────────────────────────────────────────────────┘
The objective is not to spend entire workdays watching thousands of random recordings. The real power comes from setting up quantitative behavioral alerts that instantly isolate the exact 1% of sessions where users encountered friction.
Below are the top 10 metrics every product, growth, and engineering team should monitor.
1. Rage Click Rate
A rage click occurs when a user clicks or taps an element repeatedly within a tight time window (typically 3–5 clicks in under 2 seconds). It is the digital equivalent of repeatedly hitting a non-responsive elevator button.
Why It Matters
Rage clicks represent the exact moment user intent collides with interface resistance. Common causes include: - Unresponsive or disabled buttons without visual loading indicators - Slow asynchronous network requests (delayed API responses) - Click handlers failing due to JavaScript runtime errors - Overlapping invisible DOM elements swallowing click events
How to Calculate & Benchmark
$$\text{Rage Click Rate} = \left( \frac{\text{Sessions with Rage Clicks}}{\text{Total Sessions}} \right) \times 100$$
Target Benchmark
Healthy SaaS and e-commerce apps typically aim for an overall rage click rate under 1.5%. Any core conversion CTA exceeding 0.5% rage clicks warrants immediate investigation.
Pro-Tip: Segment by Context
Do not treat all rage clicks equally. Ten rage clicks in an optional settings menu are a minor bug; three rage clicks on your primary checkout or upgrade button represent direct revenue loss. Filter by:
1. Target element: (#checkout-submit, .plan-select-btn)
2. Device / Browser: (Mobile Safari vs. Desktop Chrome)
3. Funnel Stage: (High-intent conversion steps)
2. Dead Click Rate
A dead click happens when a user clicks an element expecting an interactive response (a link, modal, expandable accordion, or filter), but the DOM produces zero state change or navigation.
Why It Matters
Dead clicks expose broken visual affordances. If a UI element has a border, hover effect, badge style, or cursor pointer that mimics a button, users will click it. When nothing happens, users experience cognitive friction and assume the application is broken.
What to Track
- Dead clicks by element selector: Group by HTML tag and CSS class.
- Dead clicks on informational cards: e.g., Pricing feature checkmarks that users expect to open tooltips.
- Dead clicks on images & mockups: Users attempting to zoom into screenshots.
Real-World Scenario
A B2B SaaS company noticed high dead click density on static tier comparison badges. By converting those dead elements into interactive feature comparison tooltips, self-serve plan upgrades increased by 14%.
3. Funnel Step Drop-Off Rate (Connected to Replay)
Funnel analysis is standard practice, but pairing funnel steps with targeted session recordings transforms passive reporting into active root-cause discovery.
Landing Page (10,000) ──► Signup Form (4,200) ──► Onboarding Step 1 (1,800) ──► Activated (450)
                             ▲                      ▲
                             │ 57% Drop-off         │ 75% Drop-off
                             └─ [View 25 Dropped]   └─ [View 25 Dropped]
How to Leverage This Metric
- Define custom funnels for key workflows (Registration, Onboarding, Checkout, Upgrade).
- Identify the step with the steepest drop-off percentage.
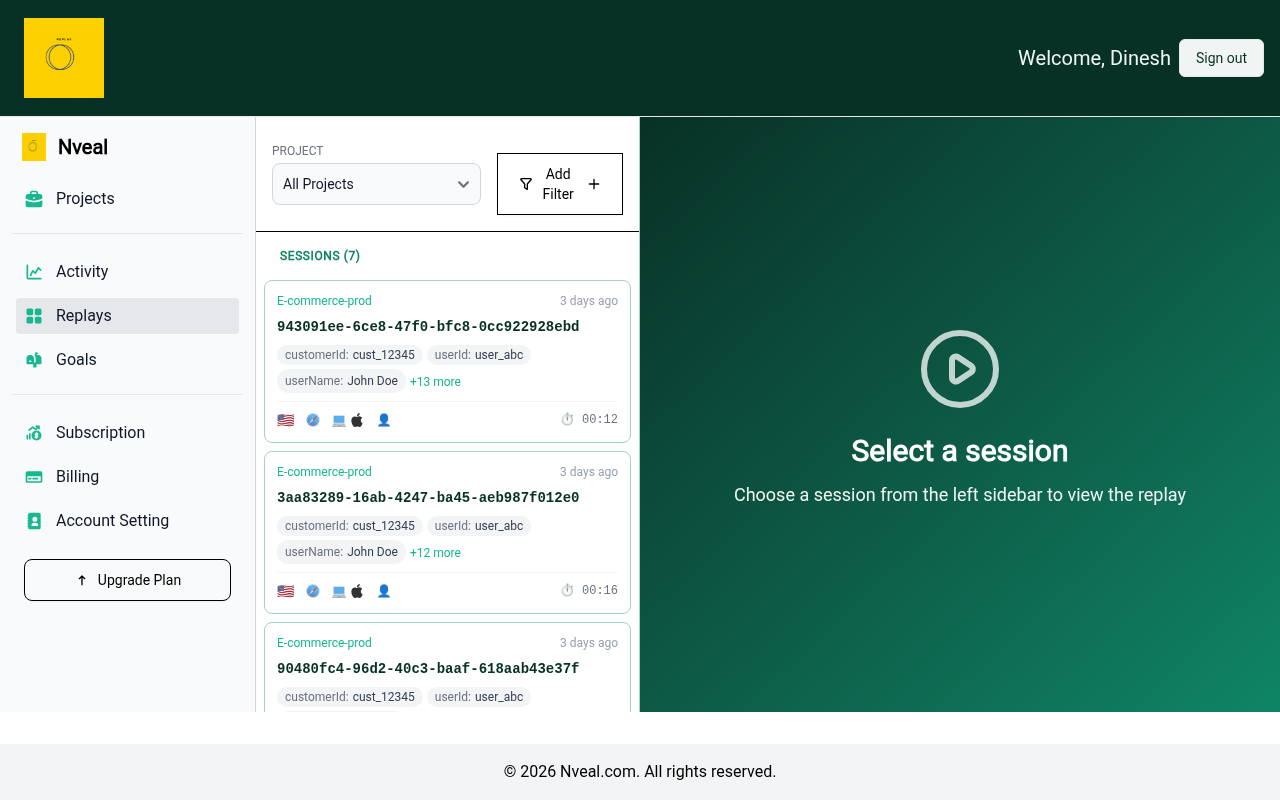
- Use Nveal's session replay filters to inspect users who dropped out at that exact step.
The Golden Rule of Funnel Debugging
Watch 5 successful sessions alongside 10 abandoned sessions for the same step. The divergence in behavior will immediately reveal whether the barrier is friction (bugs/confusion) or intent (pricing/value proposition).
4. Conversion Rate by User Journey Segment
Aggregate conversion rates hide critical disparities. A blended 4% conversion rate might obscure the fact that desktop converts at 7% while mobile languishes at 0.8%.
High-Impact Segmentation Vectors
| Dimension | Comparison Segments | What It Reveals |
|---|---|---|
| Device & OS | iOS Safari vs. Android Chrome vs. Desktop | Mobile viewport clipping, touch target sizing, keyboard overlays |
| Traffic Source | Direct / Organic Search vs. Paid Ads | Intent level vs. message mismatch on landing pages |
| User Cohort | First-time visitors vs. Returning users | Onboarding clarity vs. navigation efficiency |
| Geographic Region | Domestic vs. International users | Currency, localization, or payment gateway latency |
Diagnostic Action
When a specific cohort underperforms, isolate session replays using multi-attribute filters (e.g., Device = Mobile + OS = iOS + URL contains /checkout + Event != Purchase_Complete).
5. Form Abandonment & Field Hesitation Rate
Forms are where high-intent visitors either convert into customers or vanish forever. Tracking form performance goes far beyond just measuring total submissions.
┌──────────────────────────────────────────────────────────┐
│  Form Interaction Lifecycle                              │
│                                                          │
│  [ Form View ] ──► [ First Field Focus ] (Start Rate)    │
│                           │                              │
│                           ▼                              │
│             [ Field-by-Field Progression ]               │
│             • Time spent per field (Hesitation)          │
│             • Validation errors triggered                │
│             • Repeated field corrections                 │
│                           │                              │
│                           ▼                              │
│  [ Abandonment Point ]  OR  [ Successful Submit ]        │
└──────────────────────────────────────────────────────────┘
Key Metrics to Monitor
- Form Start Rate: Percentage of page visitors who focus on at least one input.
- Form Abandonment Rate: Percentage of users who start but never submit.
- Drop-Off Field: The exact input field where users spent the most time before abandoning.
- Field Correction Count: How many times users cleared and re-typed inputs (frequent on phone numbers, passwords, and tax IDs).
Fix the Validation, Not Just the Form Length
Teams often assume abandoned forms are "too long." Session replays frequently reveal the real issue is aggressive client-side validation that scolds users before they finish typing or vague error alerts that don't explain formatting requirements.
6. JavaScript & Network Error Rate
Silent client-side bugs are the silent killers of conversion. A user clicks "Place Order," a TypeError: Cannot read properties of undefined fires in the background, the UI spinner hangs indefinitely, and the user bounces.
What to Measure
- Sessions with JS Errors (%): Percentage of recorded sessions where unhandled exceptions occurred.
- Network Request Failure Rate: 4xx and 5xx HTTP responses on critical API endpoints.
- Errors Prior to Abandonment: Errors that occurred within 30 seconds of a session termination.
Why Connected Session Replay Is Critical
Standard error loggers (like Sentry or Bugsnag) show stack traces, but developers often can't reproduce the bug without the exact DOM state and user sequence leading up to it. Nveal captures console logs and network payloads directly in sync with user actions.
7. Scroll Depth & Content Engagement Thresholds
Scroll depth answers how far down a page users travel before converting or leaving.
0%  ── Page Header & Hero CTA ───────────── [100% of Visitors]
25% ── Feature Highlights ───────────────── [ 78% of Visitors]
50% ── Social Proof & Testimonials ──────── [ 45% of Visitors]
75% ── Pricing Matrix ───────────────────── [ 22% of Visitors] ◄── Major Drop
100% ─ Footer & Secondary CTA ───────────── [ 11% of Visitors]
Avoid the "Deep Scroll" Misinterpretation
- Myth: 90% scroll depth always means high engagement.
- Reality: A user rapidly scrolling to the footer might be frantically searching for pricing details, shipping policies, or contact information that should have been accessible in the hero section.
Diagnostic Action
Pair scroll heatmaps and session replay: - If converters consistently reach 60% scroll depth, ensure your primary CTA and value proposition are placed before that threshold. - If users scroll up and down repeatedly between two sections, there is an information gap causing hesitation.
8. Session Duration vs. Time-to-Value (TTV)
More time on site is not inherently positive. For a blog post, high session duration indicates interest. For a SaaS checkout or settings configuration, high duration often signals confusion and friction.
What to Track
- Time to First Meaningful Action (TTFMA): Seconds from page load to initiating core task (e.g., clicking "New Project").
- Time to Completion: Duration required for successful users to complete a workflow.
- Struggle Duration: Time spent on a single screen by users who abandon without completing the task.
Workflow Optimization
If successful users complete onboarding in 3 minutes, but abandoning users linger for 9 minutes bouncing between step 2 and the documentation tab, your onboarding flow has ambiguous instructions rather than engaged prospects.
9. Navigation Loops & Backtracking Rate
A navigation loop occurs when a user visits pages in a circular pattern (e.g., Page A → Page B → Page C → Page B → Page A).
Why Backtracking Signals Confusion
Users follow loops when they are actively seeking answers to make a purchase or activation decision but cannot find satisfactory information. Common causes include: - Hidden shipping costs or unclear return policies - Vague pricing plan limits (e.g., "What counts as an active user?") - Broken deep-links or confusing breadcrumb navigation
Diagnostic Action
Filter sessions with Page Visit Count > 6 on a single transaction funnel. Watch the recordings to pinpoint the missing clarity and add contextual micro-copy directly where users hesitate.
10. Friction-to-Conversion Impact (Composite Cohort Delta)
The ultimate session replay metric is the quantitative correlation between behavioral friction and business outcomes.
The Friction Impact Framework
Compare conversion rates across clean sessions versus friction-affected sessions:
| Session Segment | Conversion Rate | Delta vs. Baseline | Lost Revenue Impact |
|---|---|---|---|
| Clean Sessions (No friction detected) | 14.2% | Baseline | — |
| Sessions with Rage Clicks | 5.8% | -59.1% | High |
| Sessions with Form Validation Errors | 4.1% | -71.1% | Critical |
| Sessions with JavaScript Exceptions | 2.6% | -81.6% | Severe |
| Sessions with > 3 Backtracks | 6.4% | -54.9% | Moderate |
This calculation shifts session replay from an ad-hoc debugging utility to an executive-level growth driver. Instead of asking "How many rage clicks occurred this week?", you can report: "Eliminating the payment validation bug will recover an estimated 8.4% in lost checkout conversions."
The 7-Step Continuous Optimization Loop
To extract consistent ROI from session replay, embed this structured workflow into your weekly product sprints:
graph TD
    A[1. Business Metric Alert] -->|Drop in Checkout Conversion| B[2. Segment Anomalies]
    B -->|Mobile Safari Drop 35%| C[3. Filter Replays]
    C -->|Rage clicks on #pay-btn| D[4. Watch Sample of 10]
    D -->|Identify Root Cause| E[5. Formulate Hypothesis]
    E -->|Validation error off-screen| F[6. Ship Engineering Fix]
    F -->|Deploy v2.4.1| G[7. Re-Measure Delta]
    G -->|Conversion restored| A
- Start with a Business Metric: Monitor core funnel conversion and activation metrics.
- Segment the Anomaly: Pinpoint specific browsers, viewports, or traffic sources driving the variance.
- Filter Replays: Apply precision behavioral filters (e.g.,
Device = Mobile+Rage Click = True). - Watch a Representative Sample: Review 5–10 sessions to verify if the behavior is systemic or isolated.
- Formulate a Testable Hypothesis: Define the exact UX or technical flaw causing abandonment.
- Implement the Fix: Deploy code updates, copy adjustments, or layout changes.
- Re-Measure & Validate: Confirm that friction indicators drop and conversion rates recover.
Privacy First: Responsible Session Replay
Session recording provides deep visibility, making data protection and privacy compliance non-negotiable.
Privacy & Compliance Best Practices
Modern session replay tools must safeguard user data by default:
- Automatic PII Masking: Password fields, credit card inputs, and social security numbers must be masked at the client level before transmission.
- Selective Element Obfuscation: Use privacy attributes (such as
nveal-mask) to protect sensitive personal records or proprietary customer data. - GDPR & CCPA Compliance: Respect user consent flags and enforce automated data retention policies.
<!-- Example: Masking sensitive elements with Nveal -->
<div class="account-billing-details" nveal-mask>
  <span>User Balance: $4,520.00</span>
</div>
Summary Matrix: The 10 Metrics at a Glance
| Metric | Primary Signal | Owner | Investigation Trigger |
|---|---|---|---|
| 1. Rage Click Rate | User frustration / broken interaction | UX / Engineering | > 1.5% overall or > 0.5% on primary CTA |
| 2. Dead Click Rate | False visual affordances | Product Design | Top 5 clicked non-interactive elements |
| 3. Funnel Drop-Off | Process abandonment | Product / Growth | Steepest step drop-off in core funnel |
| 4. Journey Conversion | Device/cohort intent mismatch | Growth / Marketing | Mobile conversion < 50% of desktop |
| 5. Form Abandonment | Input friction & validation barriers | CRO / Frontend | Form completion rate < 40% |
| 6. JS & Network Errors | Unhandled technical failures | Engineering / QA | > 1% error rate on conversion paths |
| 7. Scroll Depth | Information hierarchy issues | Content / UX | Drop-off before primary CTA |
| 8. Session Duration / TTV | Task complexity & struggle | Product / UX | Task completion time > 2x median |
| 9. Navigation Loops | Unanswered questions / missing info | Content / Product | > 3 backtracks in a single session |
| 10. Friction Delta | Revenue impact of user friction | Leadership / Product | Friction cohort conversion drop > 30% |
Frequently Asked Questions (FAQ)
What is the difference between product analytics and session replay?
Product analytics (e.g., Mixpanel, Google Analytics, PostHog) measures aggregate numbers—how many people clicked a button or converted in a funnel. Session replay shows the actual qualitative visual playback of user interactions, revealing why users behaved that way. They work best together: analytics spots the anomaly, replay diagnoses the cause.
How many session replays should our team watch each week?
You should not watch random recordings. Focus exclusively on filtered cohorts: watch 5–10 sessions per week tied directly to active experiments, broken funnel steps, or high-friction alert tags (rage clicks and errors).
Do rage clicks always mean a bug is present?
Not always. A rage click indicates user expectation was unmet. This can be a hard technical bug (unresponsive button) or a soft UX issue (a disabled button without an explanation of why prerequisites were incomplete).
How does session replay handle sensitive user data and privacy?
Nveal automatically masks standard sensitive inputs (passwords, credit cards) on the client side before events leave the browser. Teams can apply nveal-mask attributes or CSS selectors to redact any additional private user data for complete GDPR and CCPA compliance.
Getting Started with Nveal
Nveal provides high-fidelity session recording, automated rage-click detection, console & network error correlation, and granular filtering in a lightweight SDK (< 5 KB).
-
Explore Session Replay
Learn how Nveal records, indexes, and reconstructs user journeys in real-time.
-
Quickstart Guide
Install the SDK and begin capturing actionable behavioral insights in under 5 minutes.
-
Start Free Trial
Ready to eliminate conversion friction on your web application?